The stock market has an extremely impressive set of buy signals going for it. If the bulls can’t capitalize on this, it’s not clear if they ever will.
First, the Standard & Poor’s 500 Index
SPX +0.14% has overcome severe resistance in the 1,330-1,340 area and has closed above there for the last two days. The 1,340 area dates back a while. It was originally support back in February and March. But, once support is broken it becomes resistance. That happened about a month ago. Since then, SPX has probed upwards towards the 1,330-1,340 area numerous times. Daily highs were frequently registered in that zone until the breakout last Friday and the hold on Monday. So, for one, the SPX chart is now positive.
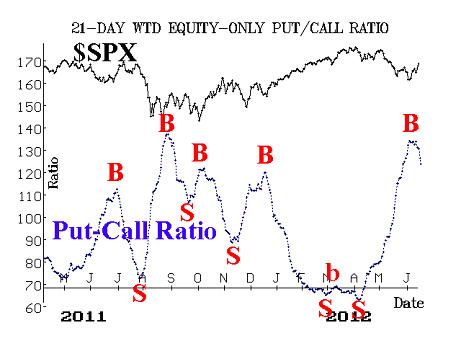
Equity-only put-call ratios reached extremely high levels before finally giving buy signals recently. These buy signals are designated by the fact that the 21-day moving average of the put-call ratio reached a peak and then begins to decline. These are important intermediate-term indicators with a strong track record.
In addition, the Total put-call ratio has given a confirmed buy signal. There has been extremely heavy put buying in the past two months, as traders have been worried about events in Europe and the like. This extreme pessimism eventually leads to buy signals, such as we are seeing now. The Total ratio encompasses all options that trade. Most of the time, that ratio is of little interest. But occasionally there is so much put buying that the 21-day moving average of that Total ratio gets extremely high. That’s what has happened, and now that moving average has peaked and begun to fall — a confirmed buy signal for the Total put-call ratio. This type of signal generally projects a 100-point rise for SPX.
Market breadth hasn’t been particularly stellar in the market rise of the past two weeks, but it is beginning to gather strength. Any new bullish breakout, such as we are seeing now, needs to have extremely positive breadth in order to fuel the advance. In one sense, that makes the market immediately overbought, but that is acceptable in the early stages of an advance. For the record, the breadth indicators that we follow are officially on buy signals, and have been for a week or so.
Volatility indexes
VIX -13.22% XX:VXO -12.71% have stubbornly remained elevated — until today. VIX has been in an uptrend, which was generally bearish for stocks. Even when VIX stopped going up, it refused to moved below the 21 level. So that became a sort of demarcation line. It seemed that as long as VIX remained above 21, that was bearish enough, and stocks couldn’t generate enough momentum to break out over resistance. But now that SPX has moved above 1,340, VIX has fallen with a resounding thud — collapsing over 13% in a single day, to close just above 18. This is another bullish confirmation.
The construct of the VIX futures can also be a useful market indicators. There are two factors that are important: 1) the amount of premium (or discount) on the VIX futures, and 2) the term structure of the futures (their relationship to each other, in price). Both of these factors are bullish at the current time. The futures all have a large premium. In fact, those premium levels increased considerably today. Moreover, the term structure slopes steeply upward (that is, each successive VIX futures contract is more expensive than its immediate predecessor in time).
So, all of the above indicators are in a bullish mode now. Furthermore, there has been a voracious appetite for protection in the form of put buying, volatility hedging, and so forth. For example, the daily volume on volatility ETFs, such as Barclays iPath S&P 500 VIX Short-Term Futures
VXX -8.22% , has skyrocketed in recent months. When so many traders are willing to pay almost any price for protection, it is probably a sign that protection isn’t necessary.
In summary, we expect the market to be able to work its way higher over the intermediate term. If the 100-point target of the Total put-call ratio buy signal is accurate, then we’d be looking at SPX rising above 1,440, which would be a new high for the post-2008 bull market. It certainly seems to be within reason now. Things can always change, of course, but for now, this is the first time since last Thanksgiving that these various indicators have all aligned bullishly.


